This webpage is a reprint, with minor stylistic alterations to suit the internet, of a paper with the same title, presented to the MATES 99 (Metering and Tariffs for Energy Supply) Conference held at Birmingham (England), 25-28 May 1999. IEE Conference Publication No CP462.
Copyright © Institution of Electrical Engineers, United Kingdom, 1998 and 1999. Reproduced here by permission.
Early
diagnosis of tariff metering faults by a systematic analysis of Main/Check
metering discrepancies.
R G Chambers.
Chambers Metercare (Consultant) Chambers Metercare Home Page
SUMMARY
A method is
described by which the integrity of MWh tariff metering systems in a Power
Station can be monitored remotely by a systematic analysis of the discrepancies
between the Main and Check meter readings. The method is cheap to implement,
using only metering data that is already in existence; it is also highly
effective in detecting tariff metering faults at an early stage of development.
The technique is recommended for metering systems on large generators, where
the financial losses resulting from inaccurate metering can be substantial.
INTRODUCTION
The electrical
energy registered by the tariff metering on a base-load 500MW generator
normally yields an annual income of around US $170M. A metering error of
-0.1% might therefore entail a loss of US $170,000 per year to the
generating company. For this reason, there is a strong financial incentive to
maintain the accuracy of generator metering to a high standard at all times.
The method described here is an analysis tool that will help the power station
to identify cost-effectively any metering system whose accuracy is drifting, so
that repairs can be effected at an earlier stage.
The Station (or
the Generating Company) keeps a database of the Main and Check MWh meter
readings for each Generator, for every half-hour metering period; this is the
duplicate of the metering database that is accessed daily by Settlements to
arrange for tariff payment. In the analysis method to be described here, the
discrepancies between the Main and Check MWh data are analysed by a database
macro, linked manually to a separate spreadsheet macro. The resulting graphs
and analysed summaries give a clear indication when a metering system has
started to drift out of calibration. The method is both cheap and effective in
detecting the onset of calibration drift, for the following reasons:
1. The primary
metering database is produced automatically by the metering system, at no extra
cost;
2. The method
of analysis is intrinsically simple;
3. The graphs
output by the analysis technique (usually) invite unmistakable conclusions on
the health of the metering system;
4. The results
of the analysis often allow a prima facie diagnosis of the cause of the
observed drift in calibration;
5. The analysis
can be done remotely, using a modem and telephone link to get the data from the
meter to the office where the analysis is performed.
DEFINITION OF
MAIN/CHECK METERING DISCREPANCY.
The Main/Check
discrepancy of a sister pair of meters, in any half-hour metering period, is
defined by:-
discrepancy = 100 ( M - C )/M percent
where M and C are
the values of MWh registered by the Main and Check meters respectively during
the metering period under study.
PRINCIPLE OF
THE DISCREPANCY ANALYSIS TECHNIQUE
A metering system
basically consists of the CTs, the VTs, wiring (including fuses, switches and electrical
joints) to connect these to the meter, and the meter itself. If the instrument
transformers remain stable, if the wiring remains in good condition, and if the
calibration characteristic of the meter itself remains constant, then there
should never be any drift in the overall calibration of the metering system
over all time. If both the Main and the Check MWh metering systems remain in
this perfect condition, the plot of the Main/Check metering discrepancy against
time, measured in years, should be a horizontal straight line running parallel
to the time axis of the graph. Any drift in the overall calibration of any
component of either the Main or the Check metering system will cause the graph
to become a sloping line. The degree of slope indicates the rapidity with which
calibration accuracy of one of these metering systems is drifting.
The method is at its most useful where both the Main meter and the Check meter is fed by its own individual set of VTs and CTs. In an inferior metering system where the Main and Check MWh meters share a common VT (or CT), a drift in the calibration accuracy of the VT would affect both metering systems equally, not producing any change in the Main/Check discrepancy.
LONG-TERM DRIFT OF THE MAIN/CHECK METERING DISCREPANCY.
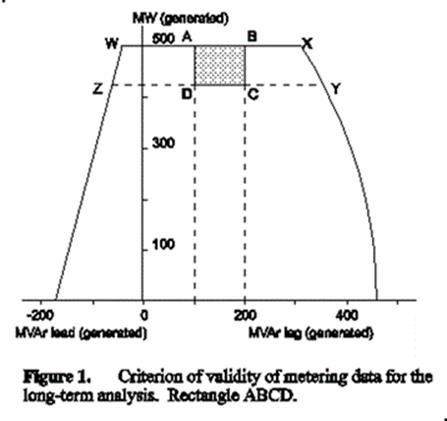
The errors of a
MWh metering system vary naturally, sometimes by as much as 0.2%, according to
the value of MW and MVAr load being measured. If these natural variations were
allowed to exist in the data, they would confuse any attempt to produce a
meaningful long-term graph of the variation of Main/Check meter deviation with
time. For this reason, each metering data point is accepted as valid for
analysis only if it falls within the box ABCD of the machine capability
diagram, Figure 1. Any metering data that falls outside this box is not used in
the analysis. This policy ensures consistency of the data in graphs that may
cover periods of several years.
![[Graph: Long-term]](paper_files/image004.gif)
Figure 2 shows the
plot of MWh Main/Check metering discrepancy against time, over a four-year
period, for Generator A and its associated Unit Transformer. Each plotted point
on the graph is the average of all the metering data collected over a one-week
interval that satisfies the validity criterion described above. Each plotted
point in Figure 2 is therefore the average of between 10 and 200 readings, the
actual number depending on the load regime of the generator for that week. Over
a one-year period between April 1994 and April 1995, the Main/Check discrepancy
of the Generator MWh meters gradually changed from -0.1% to +0.3%. At this
time, it was not normal practice to save the metering data of the Unit
Transformer for long. To the extent that data is available in Figure 2, the
Main/Check discrepancy of the Unit Transformer was changing in a manner that
mimicked the behaviour of the Generator metering. In August 1995, the Check MWh
metering of both the Generator and the Unit Transformer failed altogether. Investigation
by the Station revealed that the HV fuse protecting the 22kV side of one phase
of the Check VT had become open-circuit. They replaced the fuse (see Arrow A of
Figure 2); the Main/Check discrepancy of both items of plant returned to
approximately the same value as had existed in April 1994, before the
fuse-failure had started to develop.
At the time of
this fault, the Station had the routine of looking at their Main/Check
discrepancies once a week or once a fortnight. Nobody ever drew a graph showing
the long-term variation of the Main/Check discrepancy. The fault grew slowly,
over a fifteen-month period from May 1994 to August 1995 (Figure 2). The
changes developed so slowly that nobody noticed them. The final complete
failure of the Check metering was a surprise to the Station staff. If they had
had access to graphs shown in Figure 2, they would have been aware of the
developing fault as early as December 1994, and the failure would have been
rectified before it caused any appreciable trouble.
The failure of an
HV fuse protecting a VT is often a slow process taking months or years. Wright
and Newbery (1) describe the corona-discharge erosion process which attacks the
fuse element and is responsible for the failure. This type of failure is possible
at VT voltages of 12kV (line) or above, but becomes an increasingly likely mode
of failure for higher voltages. Because failures can take place so slowly, a
week-by-week visual inspection of the Main/Check discrepancy figures is never
likely to detect the growing fault. A graphical technique is the only method by
which a slowly-developing fault can be reliably detected at an early stage of
development.
MEDIUM-TERM DRIFT OF THE MAIN/CHECK METERING DISCREPANCY.
![[Graph: Medium-term, with mimicking]](paper_files/image006.gif)
In some investigations of metering accuracy, a medium-term or short-term plot of Main/Check discrepancy may be required. The spreadsheet macros we have developed are able to do this. A medium-term plot for Generator B and its associated Unit Transformer is shown in Figure 3. The plot covers a period of six months; data for the graph was selected by the criteria of Figure 1. Each plotted point is the nine-point moving average of the measured point itself, the four preceding, and the four succeeding points. The graph of Figure 3 was drawn because the routinely-produced long-term graph showed the start of an excursion, and the Station wished to discover more details about what might be the cause. The excursion of Main/Check discrepancy of the Generator metering in late February was -0.25%, and was mimicked by the behaviour of the Unit Transformer metering. Once again, a fault in the VT signal is indicated, since this is the only input signal shared by both sets of metering. The cause of the problem was quickly diagnosed: a knife-switch on the VT secondary signal had a high-resistance electrical contact.
NON-MIMICKED CHANGES OF THE MAIN/CHECK
DISCREPANCY.
![[Graph: Non-mimicked discrepancy]](paper_files/image008.gif)
This Section
assumes that the metering system under study includes separate Unit Transformer
and Generator metering. The Unit Transformer Main MWh meter shares a VT signal
with the Generator Main MWh meter; and similarly for the Check metering.
When a fault
develops in an individual Generator meter, the changes of Main/Check
discrepancy would not normally be mimicked by the Unit Transformer metering.
The same is (theoretically) true for any fault that might develop in the CT
signal, although the present author has not yet observed a CT fault using the
techniques described here. The presence of mimicking is therefore diagnostic of
a fault in the VT signal, while the absence of mimicking indicates either a
meter fault or a fault in the CT signal.
Figure 4 shows the
abrupt change of Main/Check discrepancy that occurred when an
out-of-calibration Generator MWh meter was replaced by a newly calibrated one.
As described in the previous paragraph, the change of meter characteristic
affected only the Generator metering, while the Main/Check discrepancy of the
Unit Transformer metering continued at its previous value.
USE OF THE
TECHNIQUE FOR ASSESSING MAINTENANCE WORK ON THE METERING.
Figure 4
illustrates another valuable feature of the spreadsheet macros. The ability to
easily plot out Main/Check metering discrepancies can be a useful tool for
assessing the calibration of a metering system after maintenance work has been
done on any of its components. The metering engineer responsible for the
maintenance can easily assess whether the jump in the graph in Figure 4
corresponds with the expected outcome of the work.
DETECTION OF A PHASE-ANGLE ERROR IN THE
METER OR IN A METERING SIGNAL.
![[Graph vs tan(phi); no fault.]](paper_files/image010.gif)
If the phase-angle
compensation of a Generator MWh meter is perfectly set up to cancel the
(actually existing) values of phase-angle errors of both the CT and the VT, the
meter should theoretically give accurate measurements at all values of power
factor angle phi. Furthermore, if both the Main and the Check meter are
perfectly set up in this way, the plot of Main/Check discrepancy against tan (phi)
should yield a line of best fit which runs parallel to the tan (phi)
axis, as in the observed results of Figure 5. The graphical data in Figure 5 is
from Generator B for the interval from January to early February 1998. This was
the period (see Figure 3) when the Main/Check discrepancies were stable, and
when the metering was fault-free.
The validity
criterion for data in the graph of Figure 5 is different from what has been
used up to now. To be valid for the present analysis, the load must fall in the
box WXYZ of Figure 1. This extension beyond the original MW/MVAr validity
box ABCD is necessary if we are to obtain a wide range of power factor angle
phi for the graph.
![[Graph vs tan(phi); with fault.]](paper_files/image012.gif)
Now consider the
situation when the phase-angle compensation of the MWh meter becomes mismatched
with the actually existing CT or VT phase errors. The resulting meter error is
theoretically proportional to tan (phi). Figure 6 shows the result of a linear
regression analysis for Generator B in the interval from late February to early
March 1998; this was a period when the metering was known, from Figure 3, to
have problems. At the 95% statistical confidence level, the slope of the line
of best fit in Figure 6 is 0.16 ± 0.06 percent/unit of tan (phi). A
theoretical analysis has shown that a slope of this magnitude would be obtained
if one (electrical) phase of the VT signal had a phase (angle) error of 0.49
centiradians. This amount of phase-angle error is unacceptable for the class of
metering used on Generator B.
We have therefore
seen that the method of analysis can detect metering faults by a graphical
technique of plotting Main/Check discrepancy against tan (phi). Graphs
of this type can easily be obtained from the metering database by use of the
spreadsheet macro.
ANALYSIS OF THE
STATISTICAL SPREAD (STANDARD DEVIATION) OF THE METERING DISCREPANCIES.
The vertical
scatter of the data points in Figure 6 has a full range (maximum - minimum) of
0.42%. This compares with a full-range scatter in Figure 5 of 0.09%.
The value of 0.09%
occurred when the metering was in a healthy state, while the value 0.42%
occurred when there were problems caused by a high-resistance contact in the
knife-switch. Any loose or dirty electrical contact, whether in an electrical
connection or (hypothetically) in a dry solder joint on a meter circuit board,
has a contact resistance which varies unpredictably. At any given time, the
resistance might be zero, or it might be sufficiently high to affect the signal
at or in the meter. This explains why some types of fault
may be accompanied by (and diagnosed by) an increased statistical variation of
the metering discrepancy values. Our software automatically calculates the
standard deviation of the discrepancy values for each meter, and reports any
meter which has an unusually high spread.
COMPANY-WIDE /HISTOGRAM
OF METERING DISCREPANCY VALUES.
![[Main/Check histogram]](paper_files/image014.gif)
Figure 7 is a
histogram of the MWh discrepancy values of the generators of two companies combined, as found in April 1998. The histogram
is produced annually, and is a useful tool for planning the meter maintenance
programme for the year ahead. Special maintenance attention is normally planned
for those metering systems that lie at the extreme left or the extreme right of
the histogram.
CONCLUSIONS
The database and
spreadsheet macros are effective in identifying metering faults at an early
stage of development. The technique is cheap to implement and simple to
understand.
REFERENCE
Wright, A. and
Newbery, P.G., 1982.
"Electric Fuses", First Edition, Peter
Peregrinus Ltd, London.
Contact
Information
The author has now retired, but will be happy
to answer any queries that arise from this paper.
Dick Chambers
Chambers Metercare
58 Primley Park Avenue
Leeds
LS17 7HU
England.
e-mail
[email protected]
Telephone
+44 (0)113-268-4406
Chambers Metercare
Home Page http://www.metercare.co.uk/index.htm